

Why is BTC stuck at 61K and where next?
Short answer: as long as 61K holds on a closing basis, a bounce stays on the table; but a lasting rally is hard until US stock indices turn.
Where price is stuck
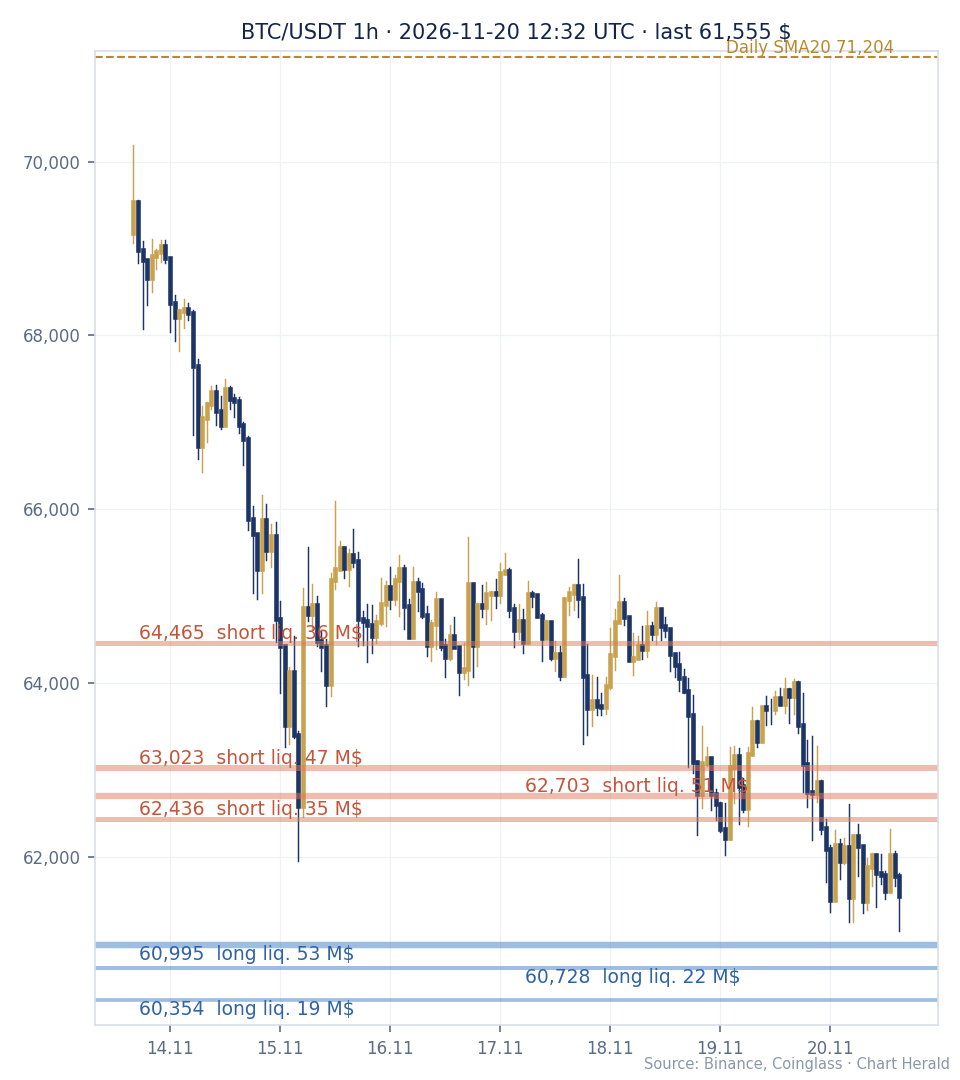
BTC has been swinging between 61,000 and 62,800 for two days. It bottomed twice, at 61,256 and 61,375, and buyers stepped in both times. On the upside, every $600 jump has been sold back as the Nasdaq kept falling.
What the liquidation map says
According to Coinglass, more than $900 million of short liquidations sit above the price, and roughly half that amount of long liquidations below. In other words, the "fuel" is on the upside. The first big block is between 62,540 and 62,860. Below, about $215 million of long liquidations sit between 60,840 and 61,210, so a quick wick below 61,000 that gets bought back is possible.
What history says
Since 2015, BTC has dropped to its monthly 50-period average six times; in five of them it bounced more than 35% within three months. Also, in 30 of 33 major support breaks, price first retraced at least 23.6% of the down leg before breaking; for this leg that level is about 67,970.
What to watch
The first sign would be Nasdaq 100 futures reclaiming their daily 7-period average (around 27,140). On the BTC side, a close above 62,860 would mean the liquidation block has been taken out. Below, a daily close under 61,000 would break this scenario, bringing 60,700 and the July low of 57,600 into play.